Usage Data and Statistics
Numbers of Annual Users
The UCSB Nanofabrication Facility has seen large user base growth extending from 1998 to the present. A decrease was seen from 2013-2015 which was primarily a result of reduced academic government funding stemming from sequestration. Since 2015, growth in both academic and industrial sectors has been observed with 2018 reaching nearly 600 users, the highest levels to date. Covid-19 deeply affected the 2020 use, but has since rebounded. The facility serves a broad range of disciplines with Optics, Electronics, Materials, MEMs, and Physics all being over 12% of use. 2025 data is shown.


External Use of Facility
The UCSB Nanofabrication Facility serves a wide range of external academic and industrial institutions across the nation. From 2006 through 2025, we have served 83 Academic/Government Institutions (with multiple research groups within some institutions) and 309 Industrial Institutions (240 being small business). This external use is not affiliated with any sponsored UCSB academic research program

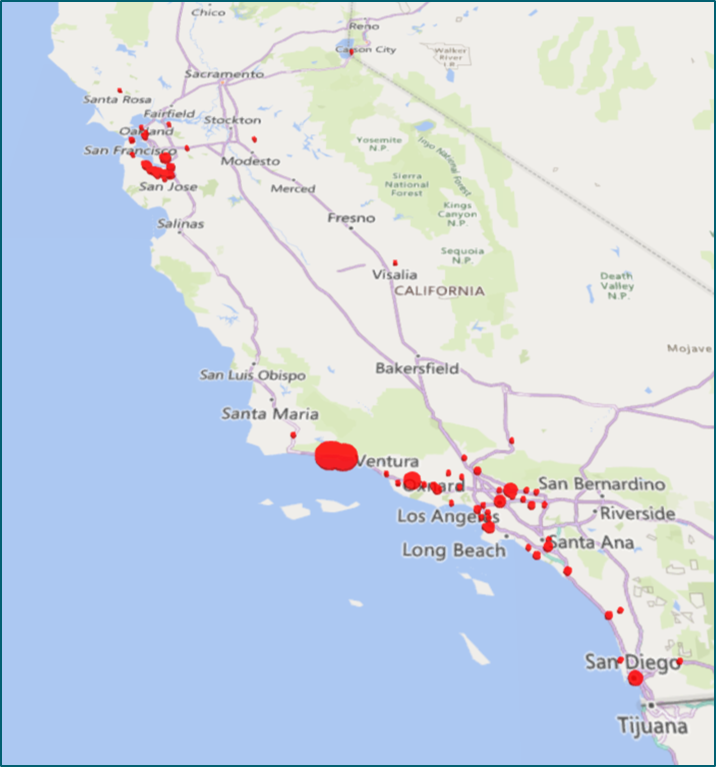
The facility has served 239 California businesses from 2006 – 2026. 75 are from the SB/Goleta area with 35 of these being formed by faculty and/or former UCSB graduate students and researchers.